Skip to content

SCIENCE & DATA 

RESEARCH-BASED METHODS at our core

At Klimato, environmental research and climate data are the backbone of everything we do. Our science-backed data and certified methodologies power our products and services, enabling consumers and businesses to make environmentally conscious decisions to reduce food-related emissions.


product-feature-dark@2x

How Food Impacts the Climate

Our global food system accounts for 1/3 of all worldwide greenhouse gas emissions, meaning our current eating habits have a bigger impact on the climate than all global transport combined. This calls for an urgent sustainable transformation of the food system. Luckily, something as simple as a climate-friendly diet can be the solution to all of this. But how do we know which food is climate-friendly? Well, let us welcome science to join us at the table.

Every food product goes through several stages during the production process, including raw material extraction, farming, factory processing, and transportation. All these stages release various amounts of emissions, commonly referred to as greenhouse gas emissions. The most common greenhouse gases are carbon dioxide, methane, and nitrous oxide. The amount of emissions released is measured in carbon dioxide equivalents (CO2e) to have one standardized unit to compare the effect of different gas emissions. This CO2e measurement is thus referred to as the carbon footprint of a food product or a meal. When emissions reach high levels in the air, they get trapped in the atmosphere, which eventually increases the temperature on Earth—and we experience climate change.

So the relationship between climate change and what we put on our plate is that our current diets consist of too many food products with carbon footprints too high for the planet to cope with. To reduce the climate impact of food, we need to make a shift in our eating habits by cooking, serving, and eating meals made with food products that have lower carbon footprints.

The Klimato Database

The Klimato Database has been developed through a systematic literature review of different food products’ carbon footprints. The review includes literature sources such as peer-reviewed papers, conference proceedings, and open-source databases published from 2009 to 2023. The studies follow attributional Life Cycle Assessment (LCA), an ISO-standardized method (ISO 14040-14044) used to calculate the carbon footprint of products, services, and processes.

The Klimato Database contains country-specific carbon footprint data for both conventional and organic production methods. It includes over 4,000 ingredients in more than 19,000 variations (different countries of origin and production methods).

The carbon footprint values in the database are reported in kg CO2e/kg of food. Meat products are expressed considering their retail weight. Klimato includes agricultural production, processing, packaging, and transport. Food losses occurring at all stages are also included. When statistical Land Use Change (LUC) (contributions to climate change when land transformations occurred in the past 20 years) is available in assessed studies, Klimato includes it in the overall carbon footprint of food.

The Klimato Database is a collection of emission factors used to assess the climate impact of the food procured by food businesses. Moreover, it is used to calculate the carbon footprint of the recipes served by food service providers. Ultimately, the recipes are rated based on a set of thresholds and expressed by climate labels developed by Klimato based on the latest climate science.

number-icons_unique@3x
0
Ingredients
number-icons_variations@3x
0
Variations
number-icons_factors@3x
0
Emission Factors
number-icons_countries@3x
0
Countries

ENSURING ACCURACY THROUGH SCIENTIFIC PARTNERSHIPS with trusted institutions

By partnering and collaborating with prominent research institutes, we ensure that our carbon footprint data and methodologies follow best practices and are constantly updated to reflect the most recent scientific findings and research.

The Klimato Database is developed by Klimato’s science team, following research procedures and methodologies reviewed and approved by the Swedish Environmental Research Institute (IVL).

Klimato is also an officially licensed software and tools partner of the Global Reporting Initiative (GRI), empowering companies in the food sector to assess and report their GHG emissions with the utmost precision and accountability. By joining the GRI Licensing Program, Klimato guarantees full integration of the GRI Standards and their fundamental principles within its software solutions.

Additionally, the World Resources Institute (WRI) has reviewed the Klimato methodology and validated that it is consistent with and meets the requirements of the Coolfood Methodology. 

Klimato is approved and used by One Planet Plate, an initiative by the World Wide Fund for Nature (WWF). 

How will CSRD affect your food business? Understand the sector-specific impacts of CSRD with our comprehensive guide.  
Group 14

The Klimato labeling system

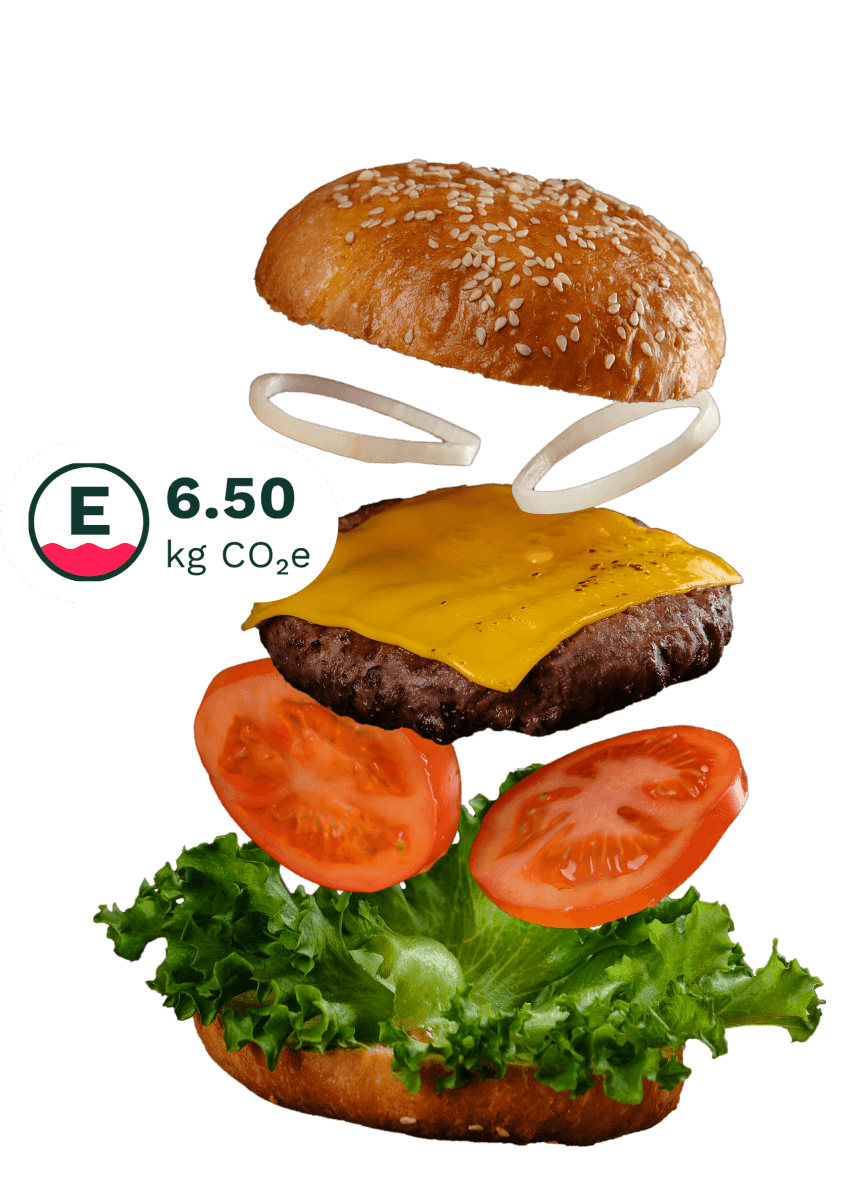
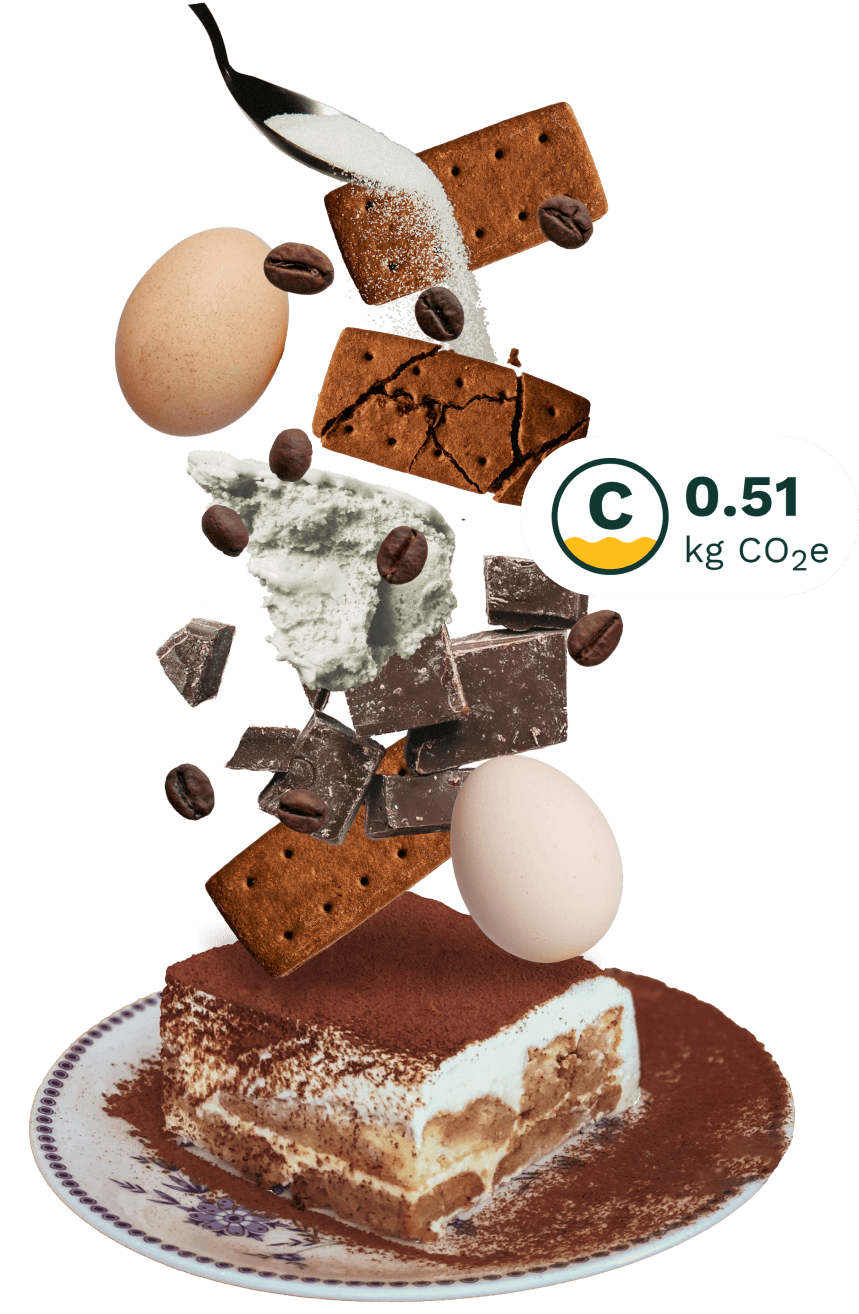
The Klimato labels provide two critical pieces of information: the absolute CO2e emissions per serving (kg CO2e/serving) and a rating (A-E) based on the carbon intensity—the carbon footprint (CF) of a standardized full-size meal weighing 400g. This approach ensures fair comparison between servings of different portion sizes.

The reference value for the full-size meal is calculated based on the recommended food intake for a healthy and sustainable diet, as outlined by the EAT-Lancet Commission. This assumes that one meal accounts for approximately 30% of the daily intake, aligning with dietary guidelines for sustainability and nutrition.

To rate the dishes, we calculate their carbon intensity, that is the CF value of the dish normalized to 400g. Depending on the carbon intensity, the dish is then rated based on the following tiers:

Very Low (A) Carbon intensity < 0.40 kg CO2e
Low (B) 0.40 kg CO2e ≤ carbon intensity < 0.90 kg CO2e
Medium (C) 0.90 kg CO2e ≤ carbon intensity < 1.80 kg CO2e
High (D) 1.80 kg CO2e ≤ carbon intensity < 2.60 kg CO2e
Very High (E) carbon intensity ≥ 2.60 kg CO2e
Group 15

Science-Backed Thresholds

The foundation of Klimato’s five-tiered system is rooted in the latest climate science. The "Very Low" and "Low" thresholds align with the 2030 and 2050 targets of the Paris Agreement, aimed at keeping the global temperature increase to well below 2°C above pre-industrial levels. Higher thresholds signify the risk of overshooting these limits.

The thresholds are defined as follows:

0.40 kg CO2e/meal
Klimato estimated the food-related GHG emissions per person per day in Europe in 2015. Considering that one meal accounts for 30% of daily emissions, this value represents the average emissions per person per meal. To meet the Paris Agreement goal of limiting the global temperature increase to well below 2°C, global food-related GHG emissions must be reduced by 72% by 2050, relative to 2015 levels.

0.90 kg CO2e/meal
This threshold is calculated similarly, considering a 38% reduction in global food-related GHG emissions by 2030, relative to 2015 levels. This reduction is necessary to ensure the world remains on the pathway to the 2050 Paris Agreement goals. This threshold aligns with the World Resources Institute's definition of Coolfood Meals.

1.80 kg CO2e/meal
This threshold is based on the Transient Climate Response to Cumulative Carbon Emissions (TCRE) metric, which relates global temperature increase to GHG emissions. Using TCRE, Klimato estimated the average CO2e per person globally in 2050, corresponding to a 2.5°C temperature increase. Assuming 31% of these emissions come from the food sector, this value represents the food-related emissions per person per meal associated with a 2.5°C increase.

2.60 kg CO2e/meal
The high threshold is calculated using TCRE to estimate the CO2e per person globally in 2050, corresponding to a 3°C temperature increase. Assuming 31% of these emissions come from the food sector, this value represents the food-related emissions per person per meal linked to a 3°C increase by 2050.

Constant Improvement

Although we are proud to have one of the most comprehensive food climate databases in the world, we are constantly working to stay up to date with latest research in order to provide environmental impact values in line with the latest climate science.

GET KLIMATO & BECOME
SUSTAINABLE TODAY
.

We're a team of scientists and technologists building tools to help food businesses become more sustainable.